Automatic Feature Matching Across Images
Developer
2026
Computer Vision, Algorithm Design, Testing
Python, NumPy, scikit-image
Individual project
Overview
Built a system for automatically detecting corresponding image features, following Brown et al.'s Multi-Image Matching Using Multi-Scale Oriented Patches. The pipeline detects candidate corners, suppresses redundant points, extracts normalized local descriptors, and accepts reliable matches with a nearest-neighbor distance-ratio test.
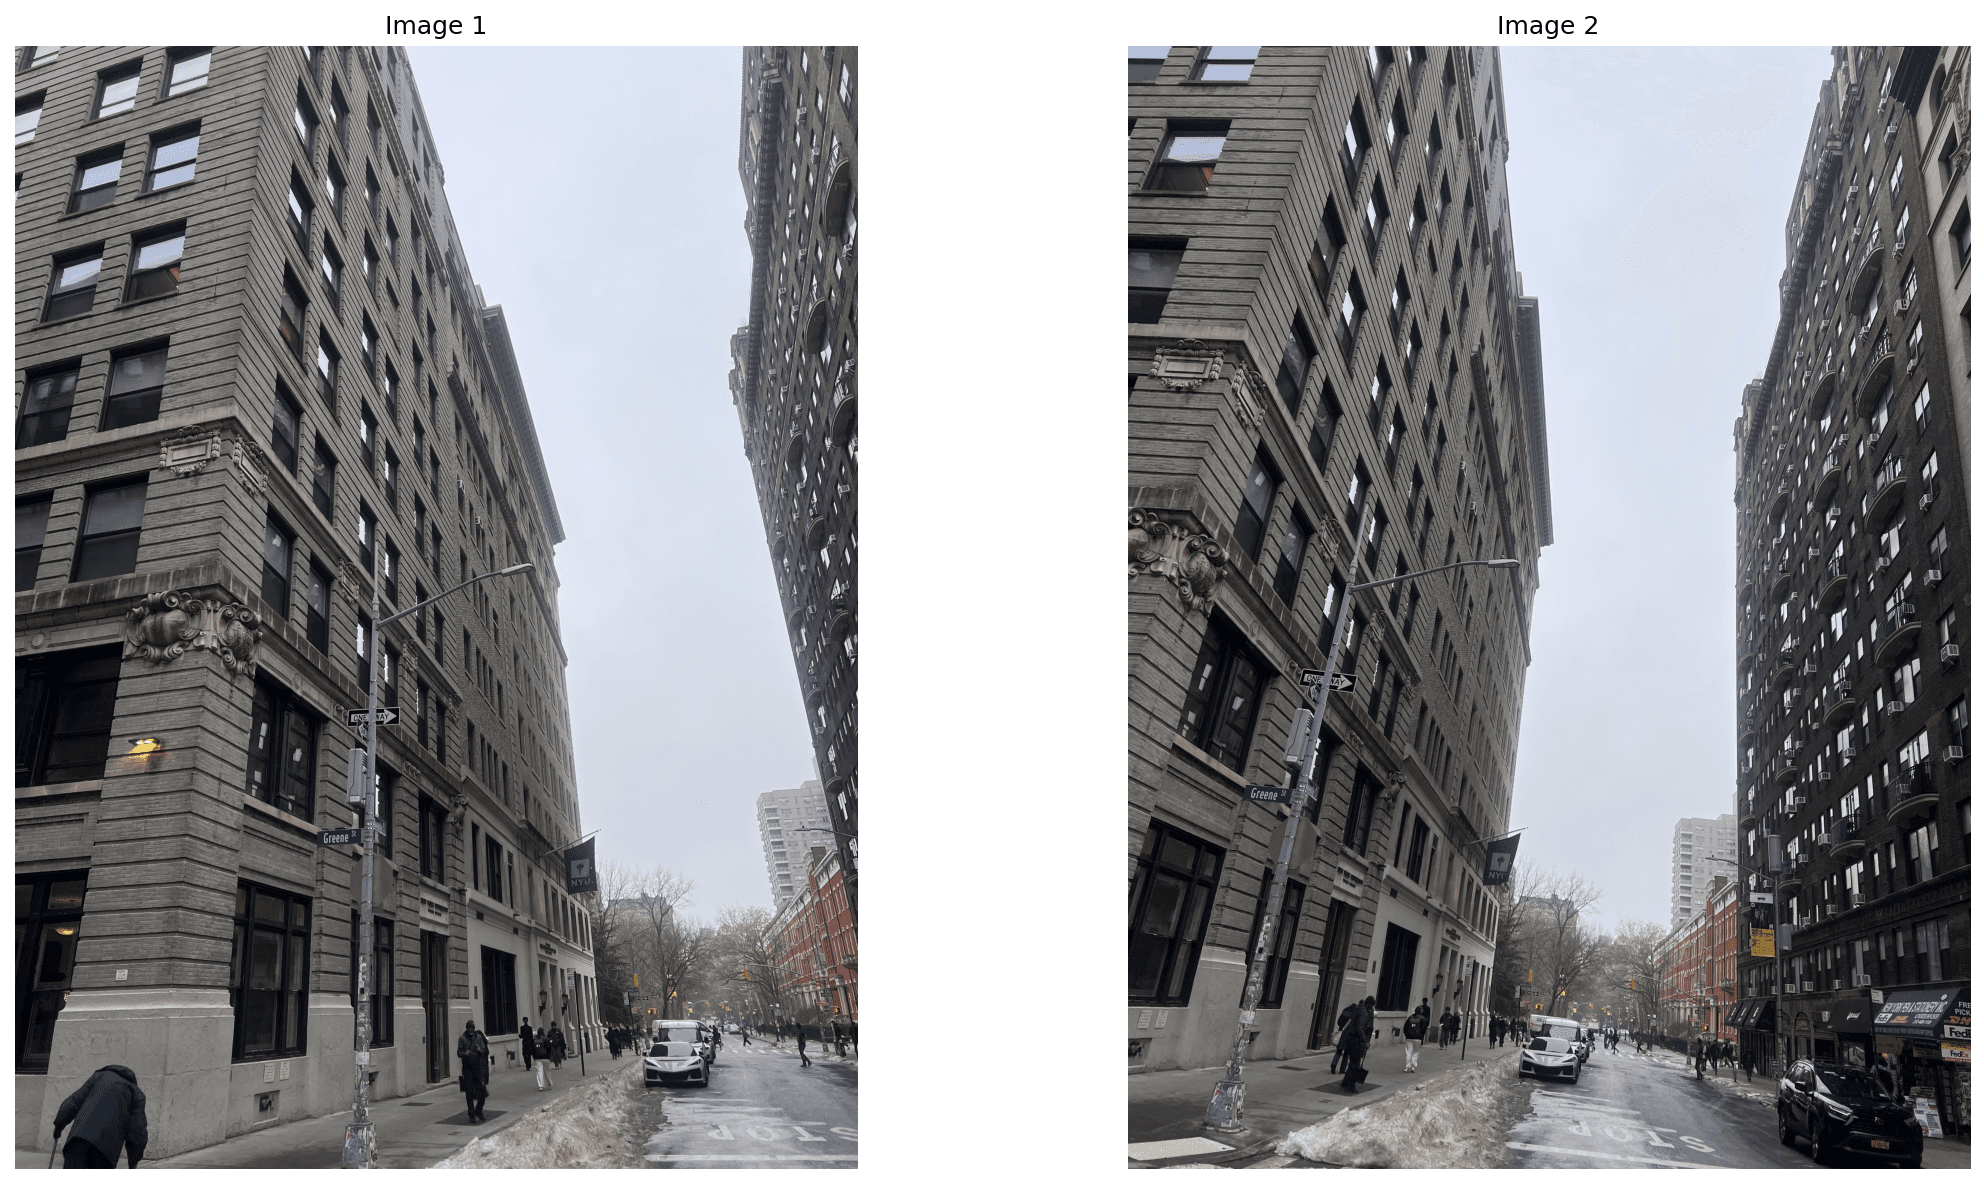
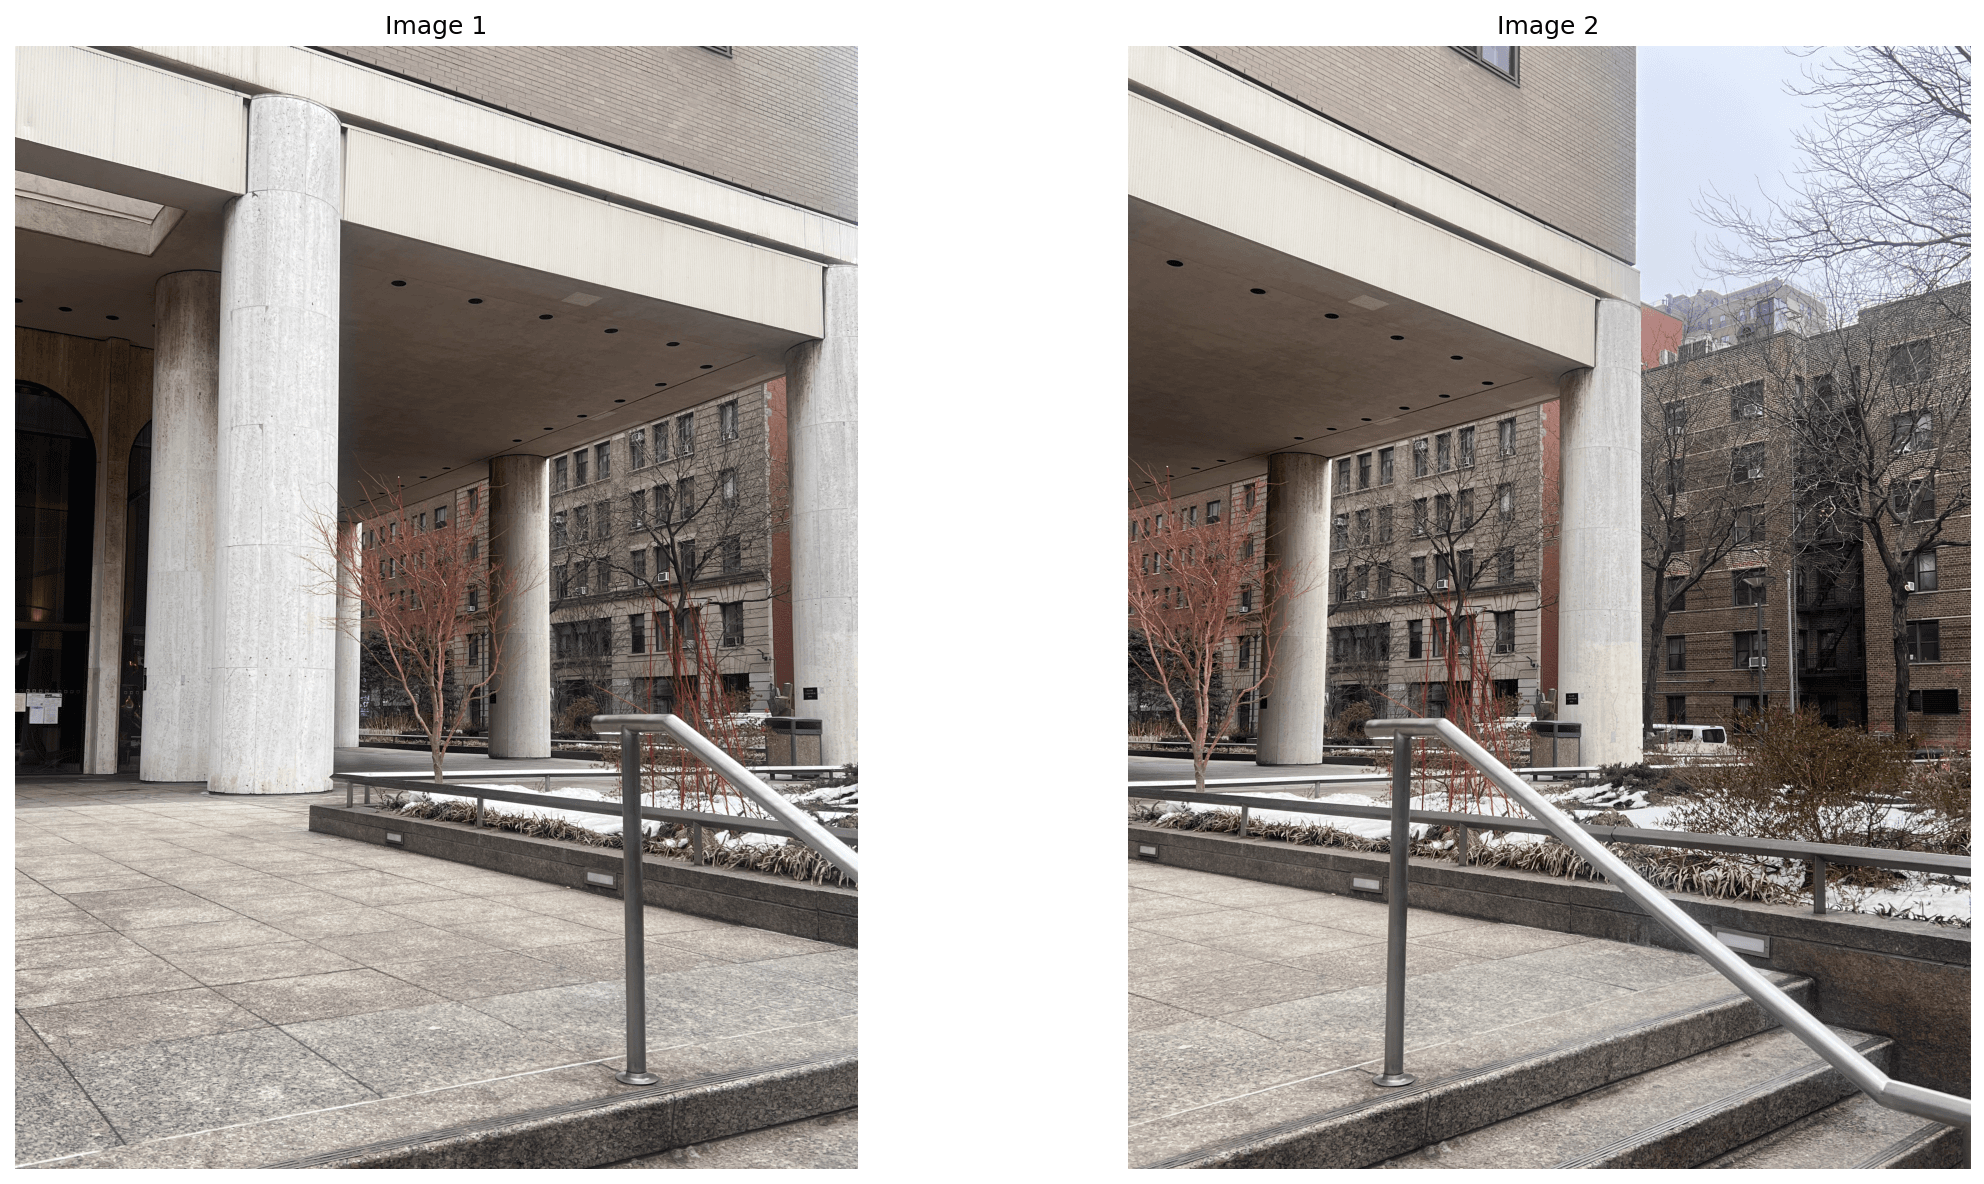
The implementation uses Python, NumPy, Matplotlib, and scikit-image. It processes two image pairs: img1.jpg/img2.jpg and img5.jpg/img6.jpg.
1. Harris Corner Detection
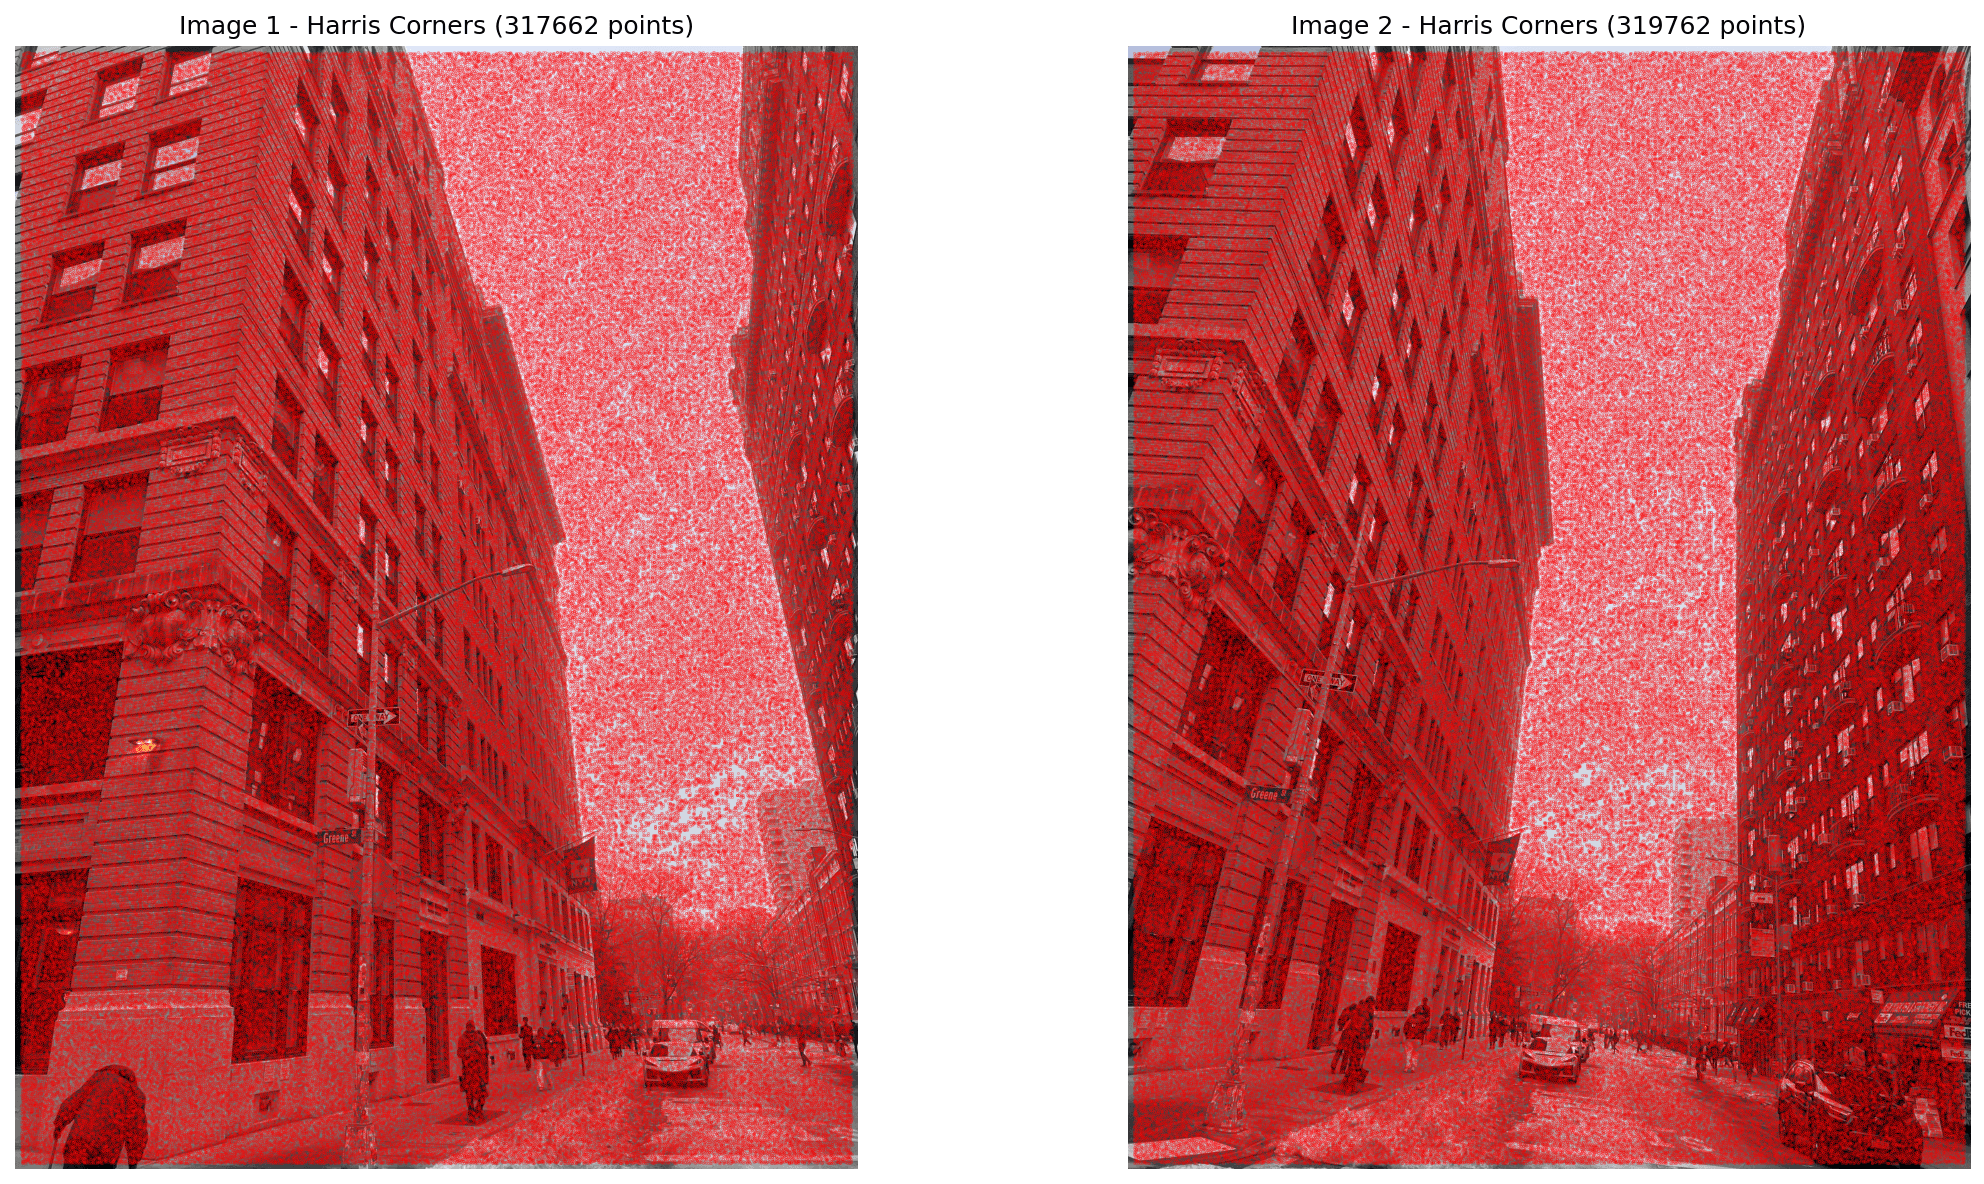
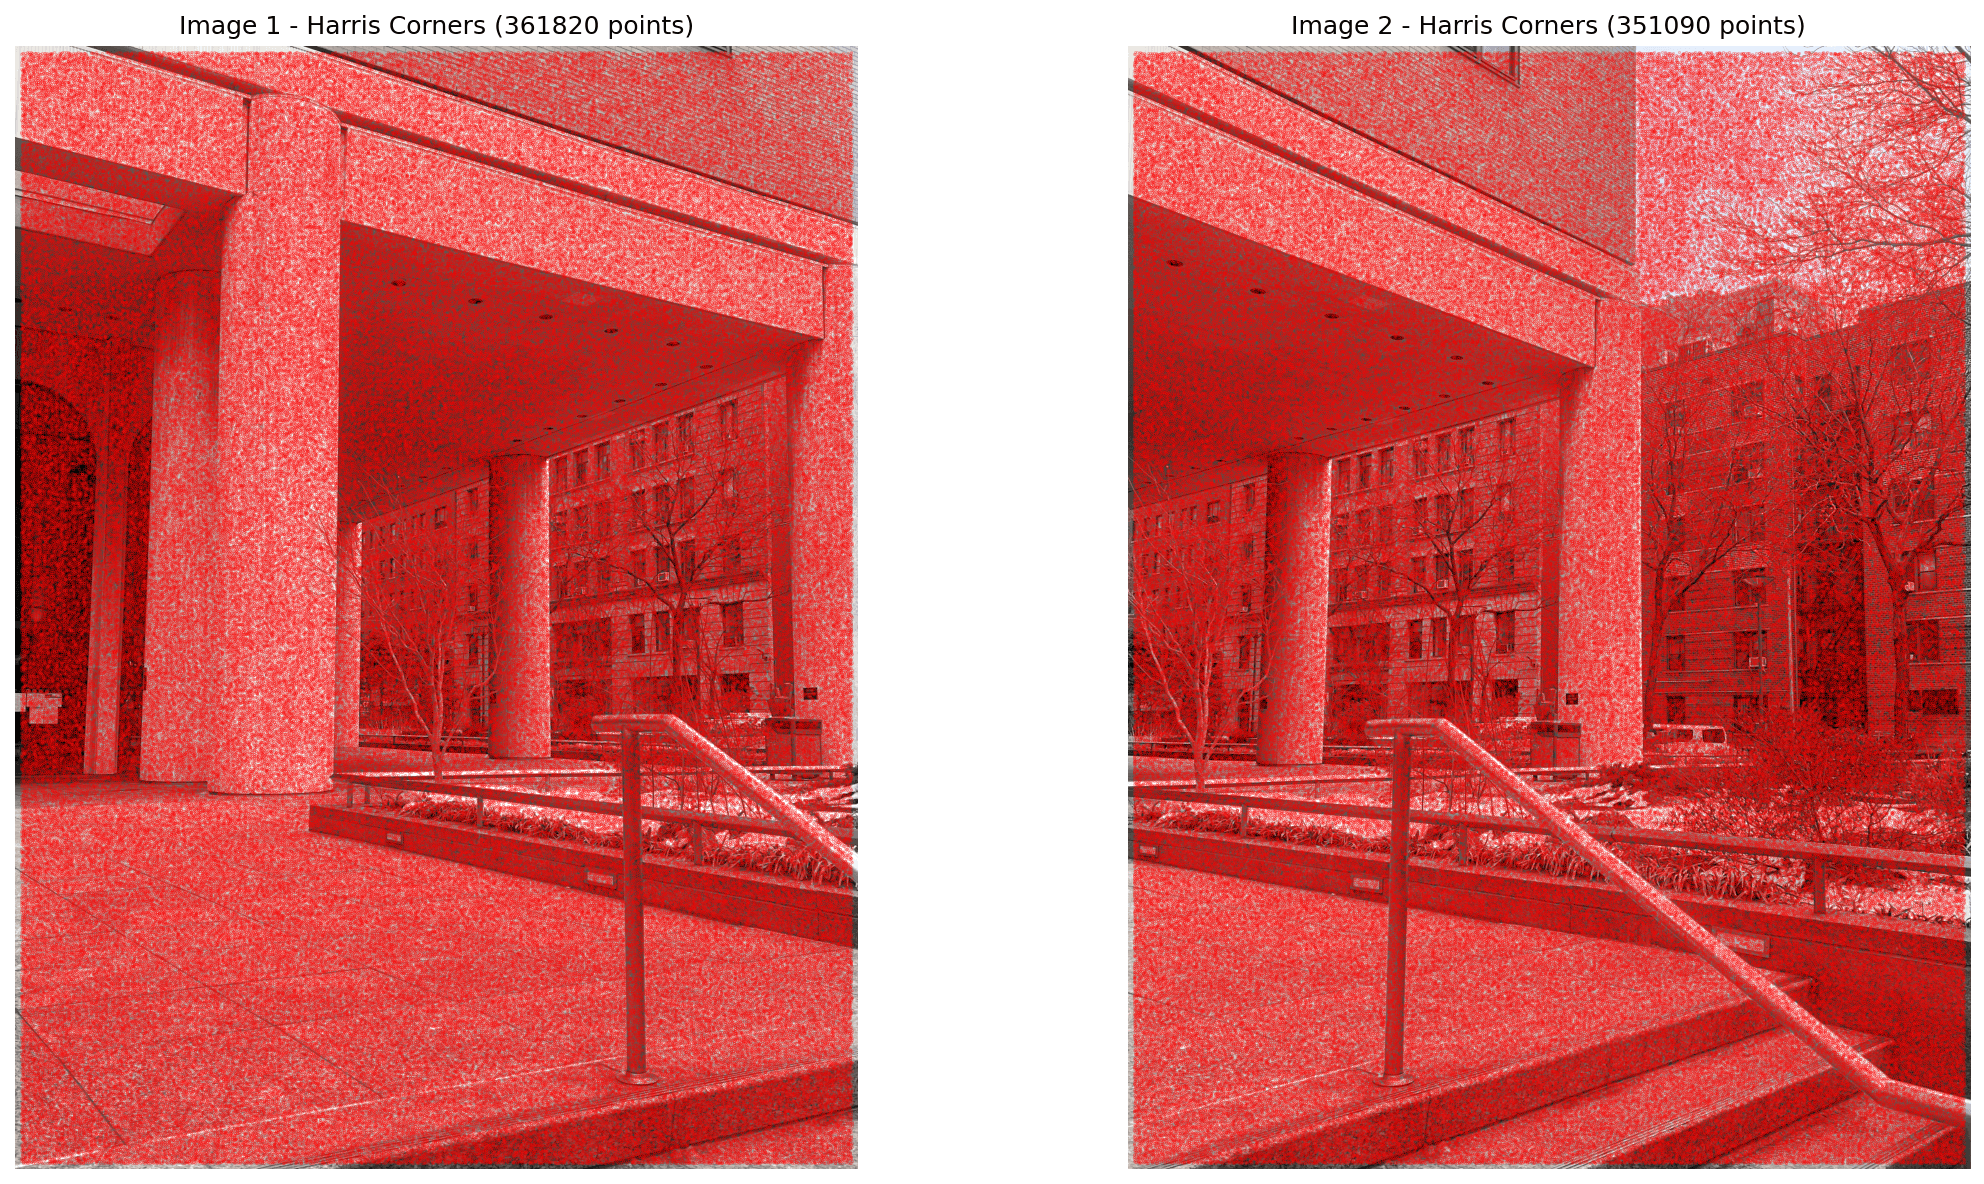
I converted each image to grayscale and used the provided Harris detector with the eps method, sigma=1, and a 20-pixel edge discard. The detector returned more than 30,000 corners per image, so rendering every point initially made the images unreadable.
For the diagnostic overlay, I reduced marker size to 0.5 and set alpha to 0.5. The dense response makes clear why the next stage is necessary: raw Harris detection supplies many candidate corners, not a compact set of discriminative interest points.
2. Adaptive Non-Maximal Suppression
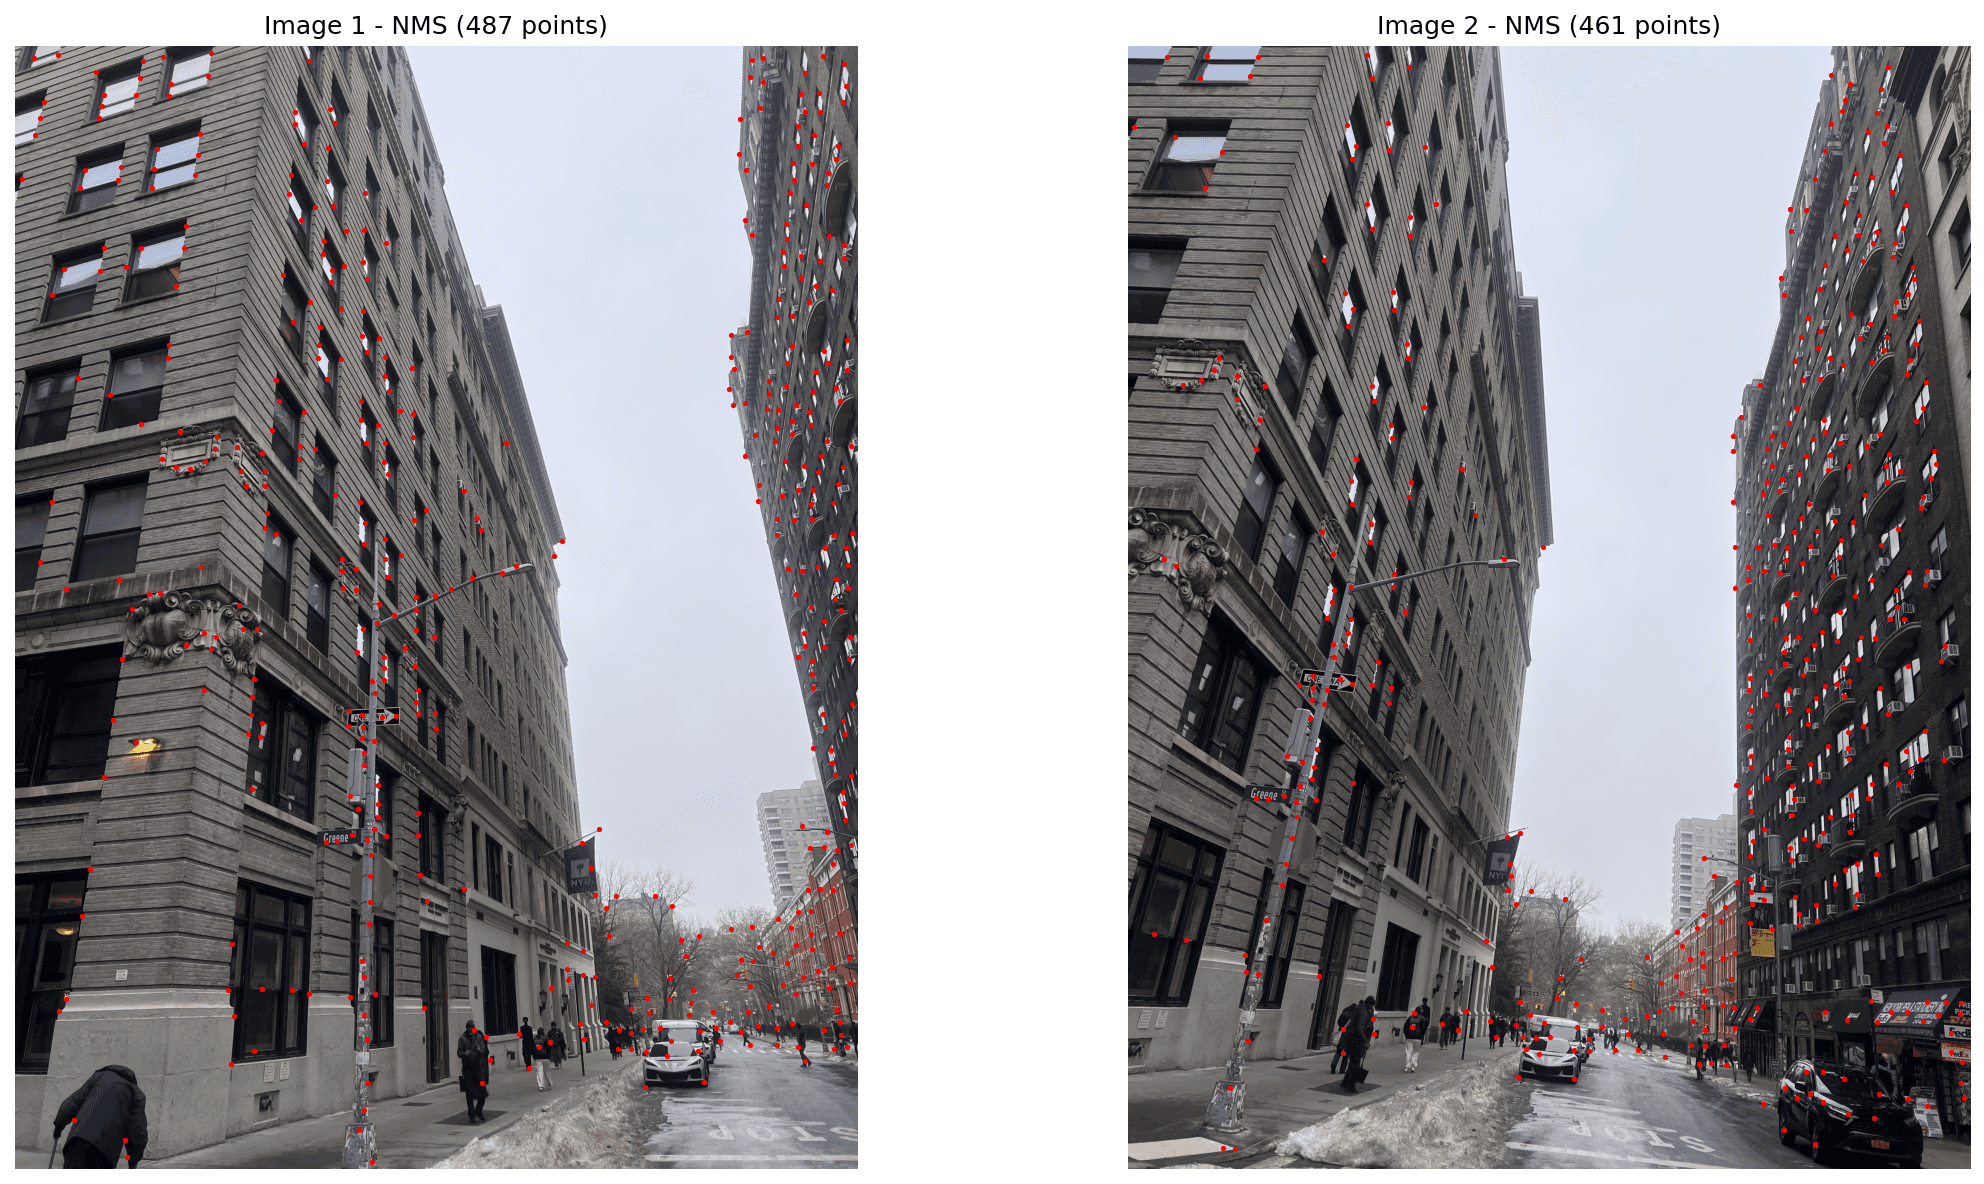
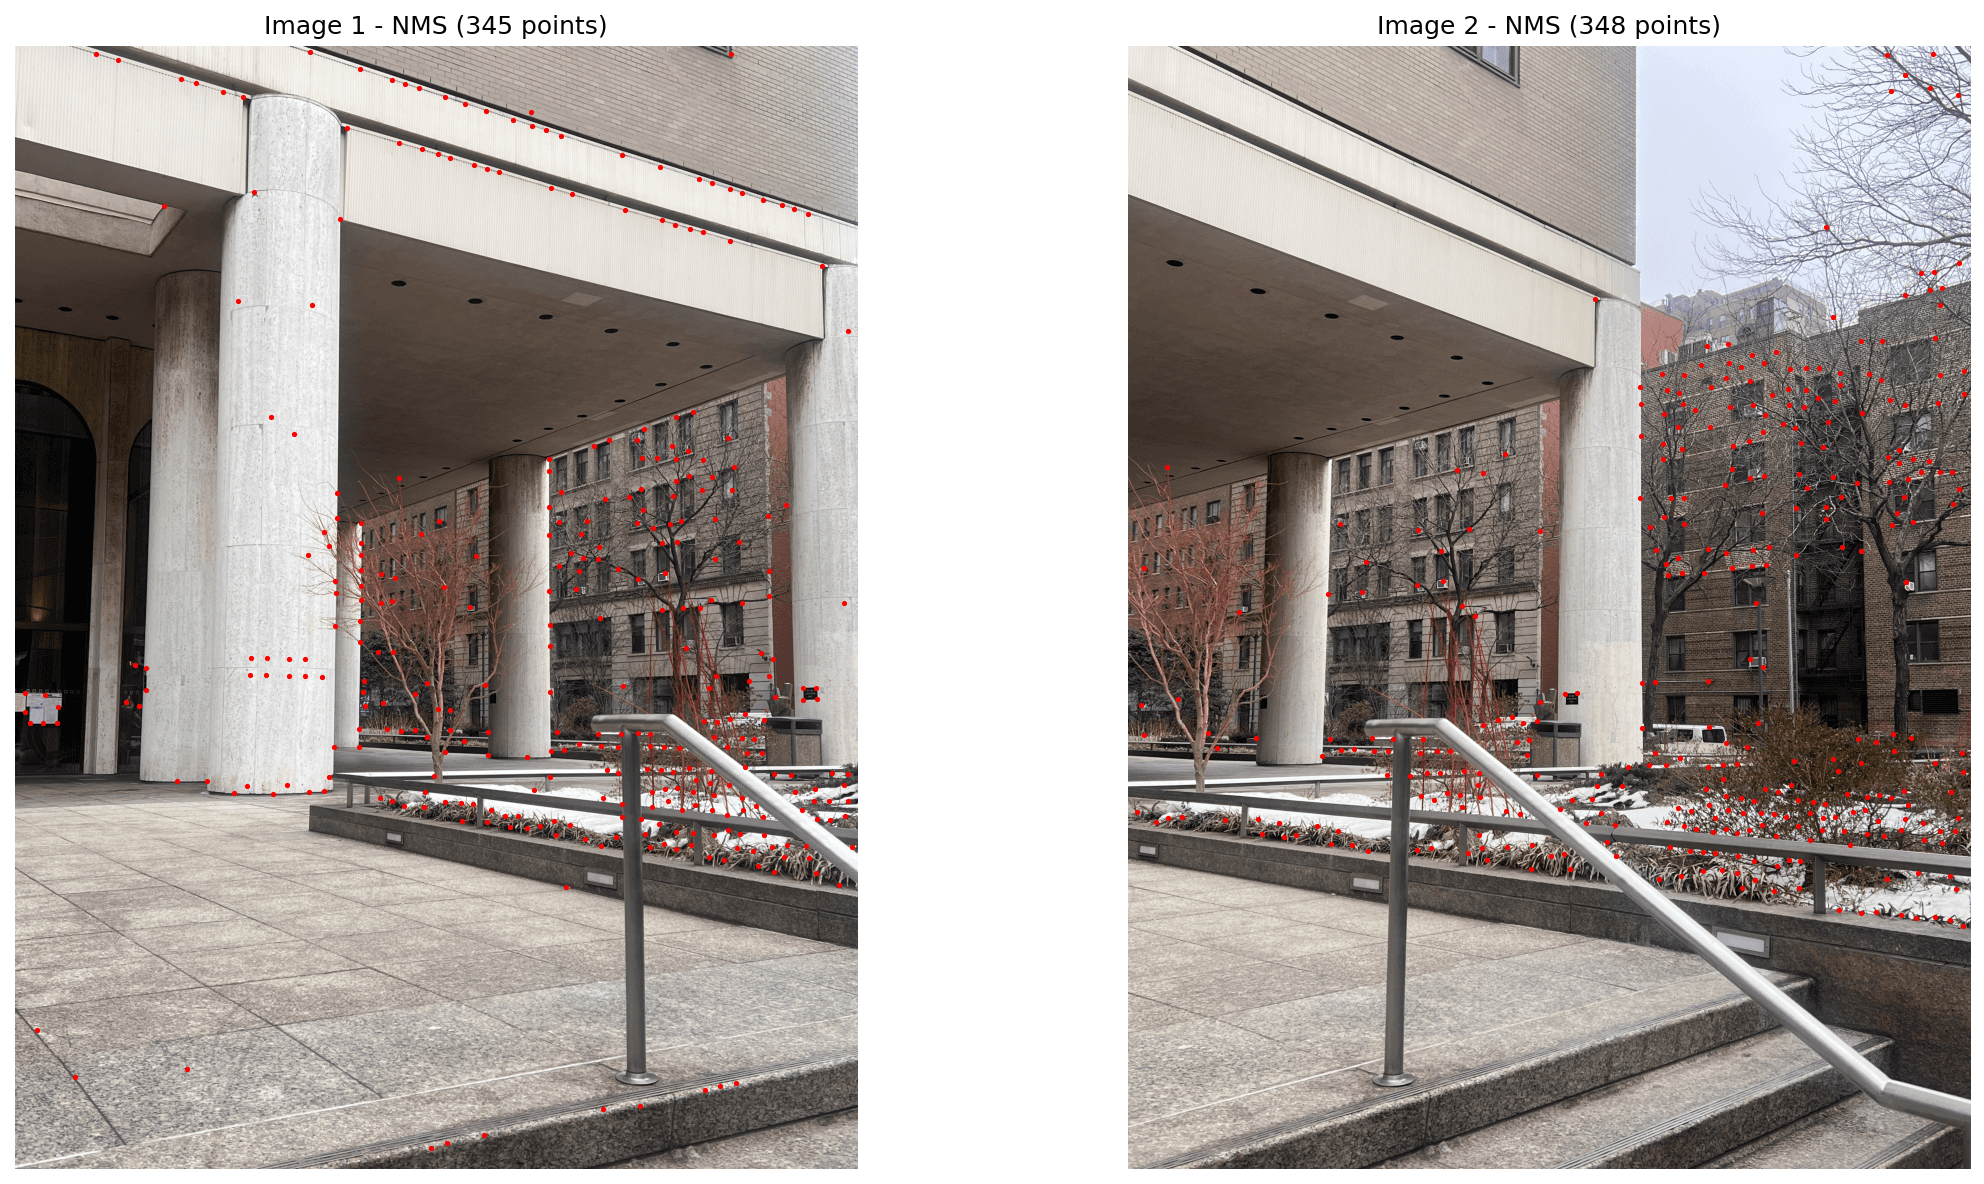
I implemented non-maximal suppression from scratch with nested loops. First, I calculated each corner's Harris strength and kept the 2,000 strongest candidates to make the subsequent comparisons tractable. Candidates are sorted in descending strength so a strong point suppresses weaker nearby points, rather than the reverse.
For every retained candidate, the implementation checks whether the absolute x and y differences from another point fall within half the suppression window. A point inside that local neighborhood is suppressed. An initial implementation overwrote the strength variable during iteration, leaving one surviving point; rebuilding the strengths array fixed the issue.
I began with a 20-pixel window, which retained too many points. A 40-pixel window produced roughly 480 points in testing; the final visualization run uses an 80-pixel window.
3. Local Feature Descriptors
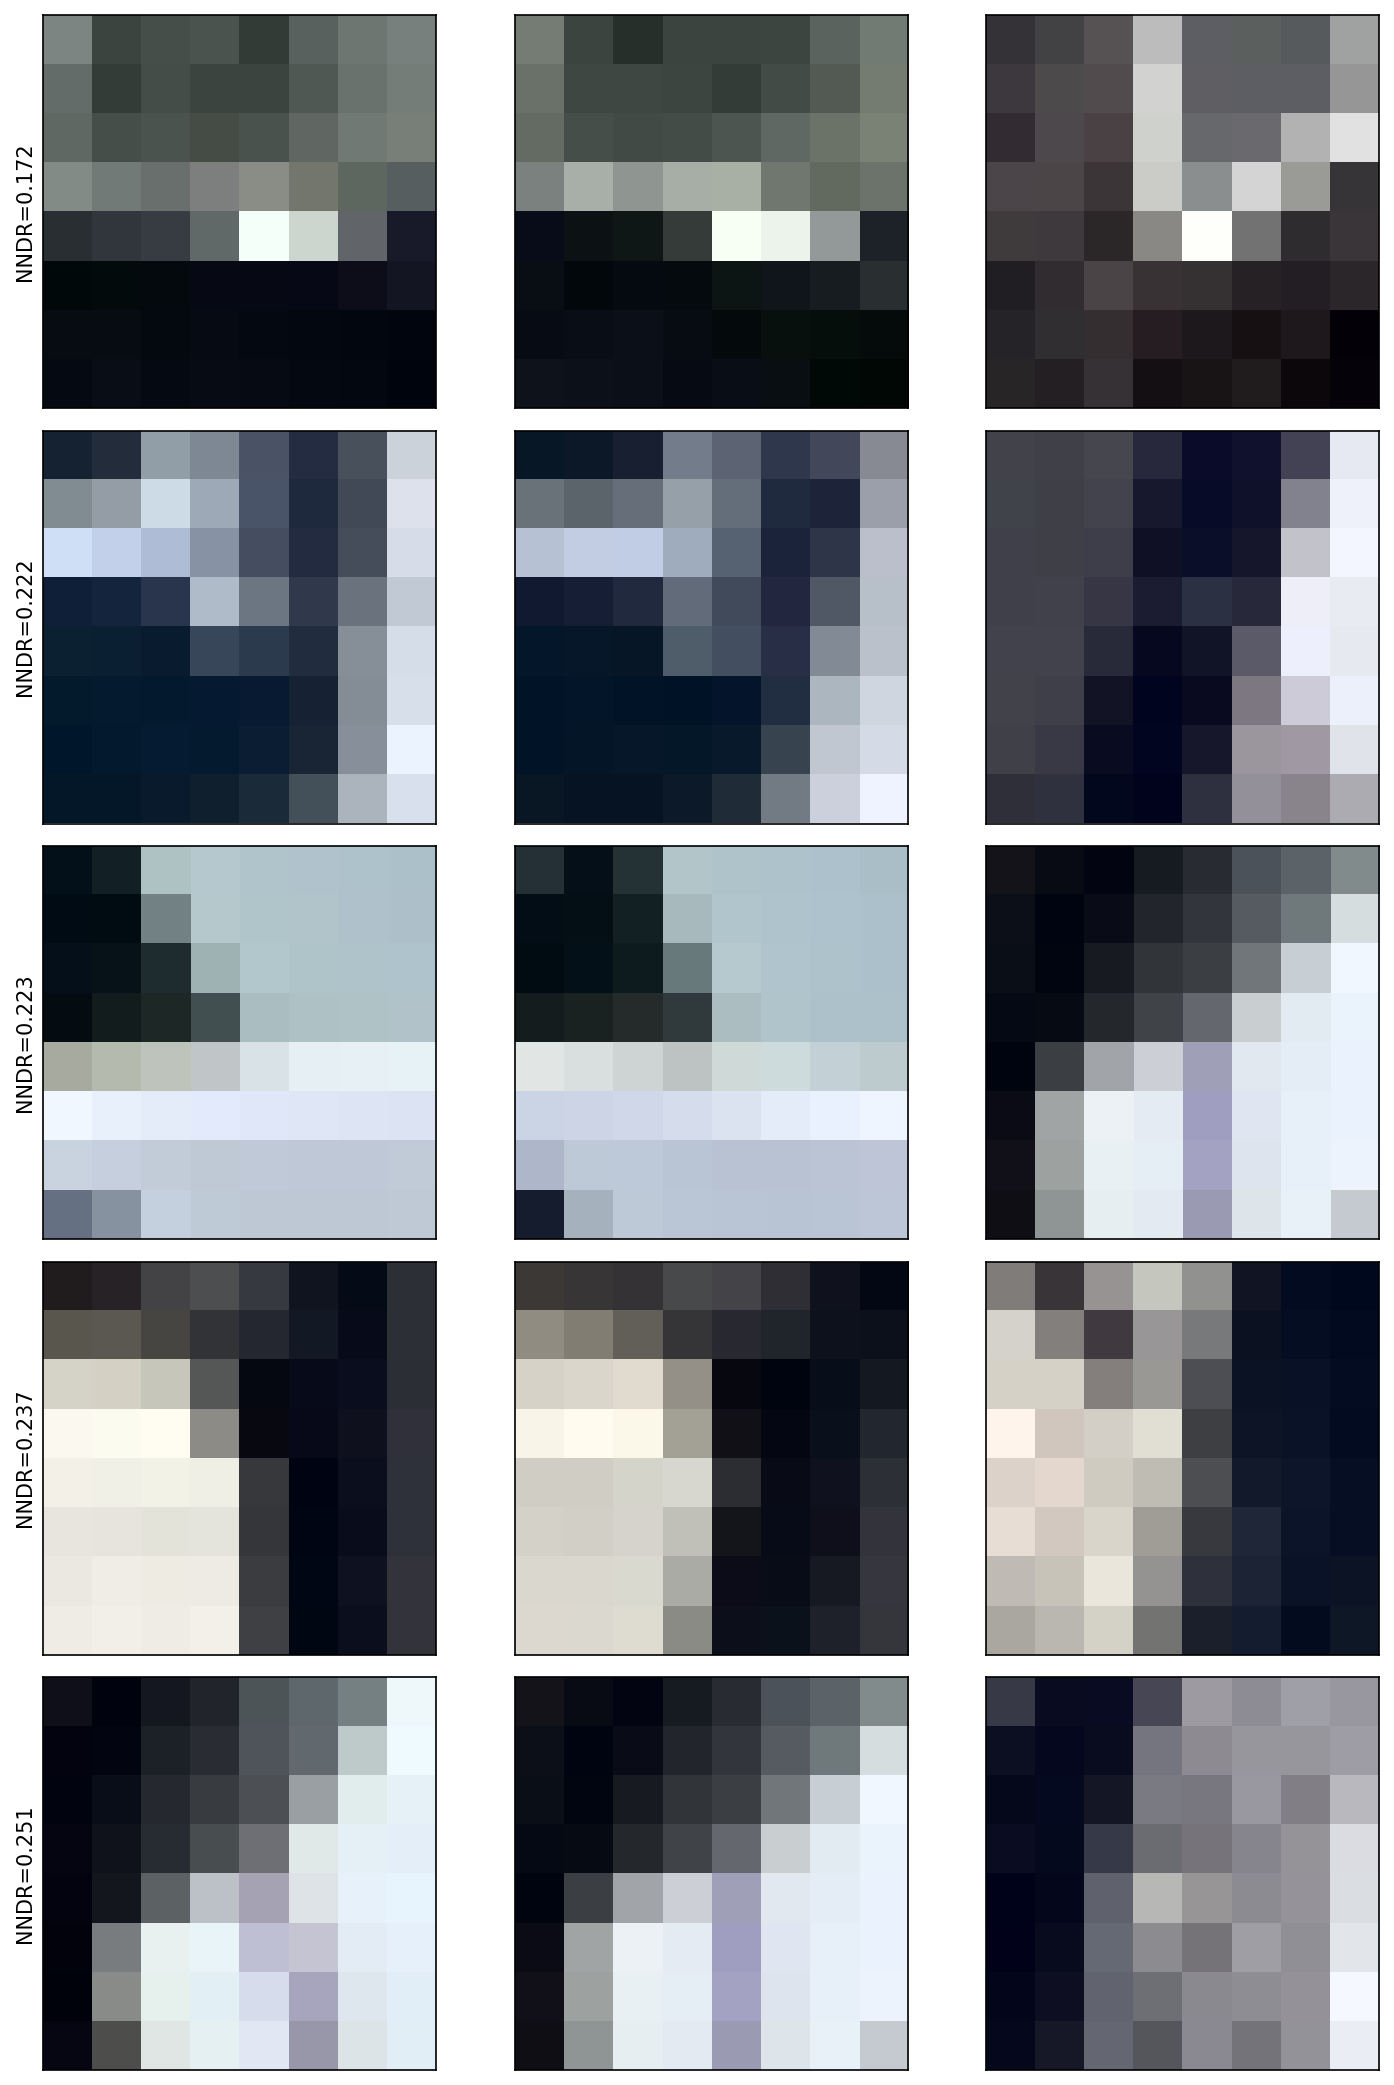
For every surviving interest point, I extracted a 40×40 pixel patch centered at its location and resized it to 8×8 with anti-aliasing. I initially used grayscale descriptors, then switched to RGB patches following TA guidance.
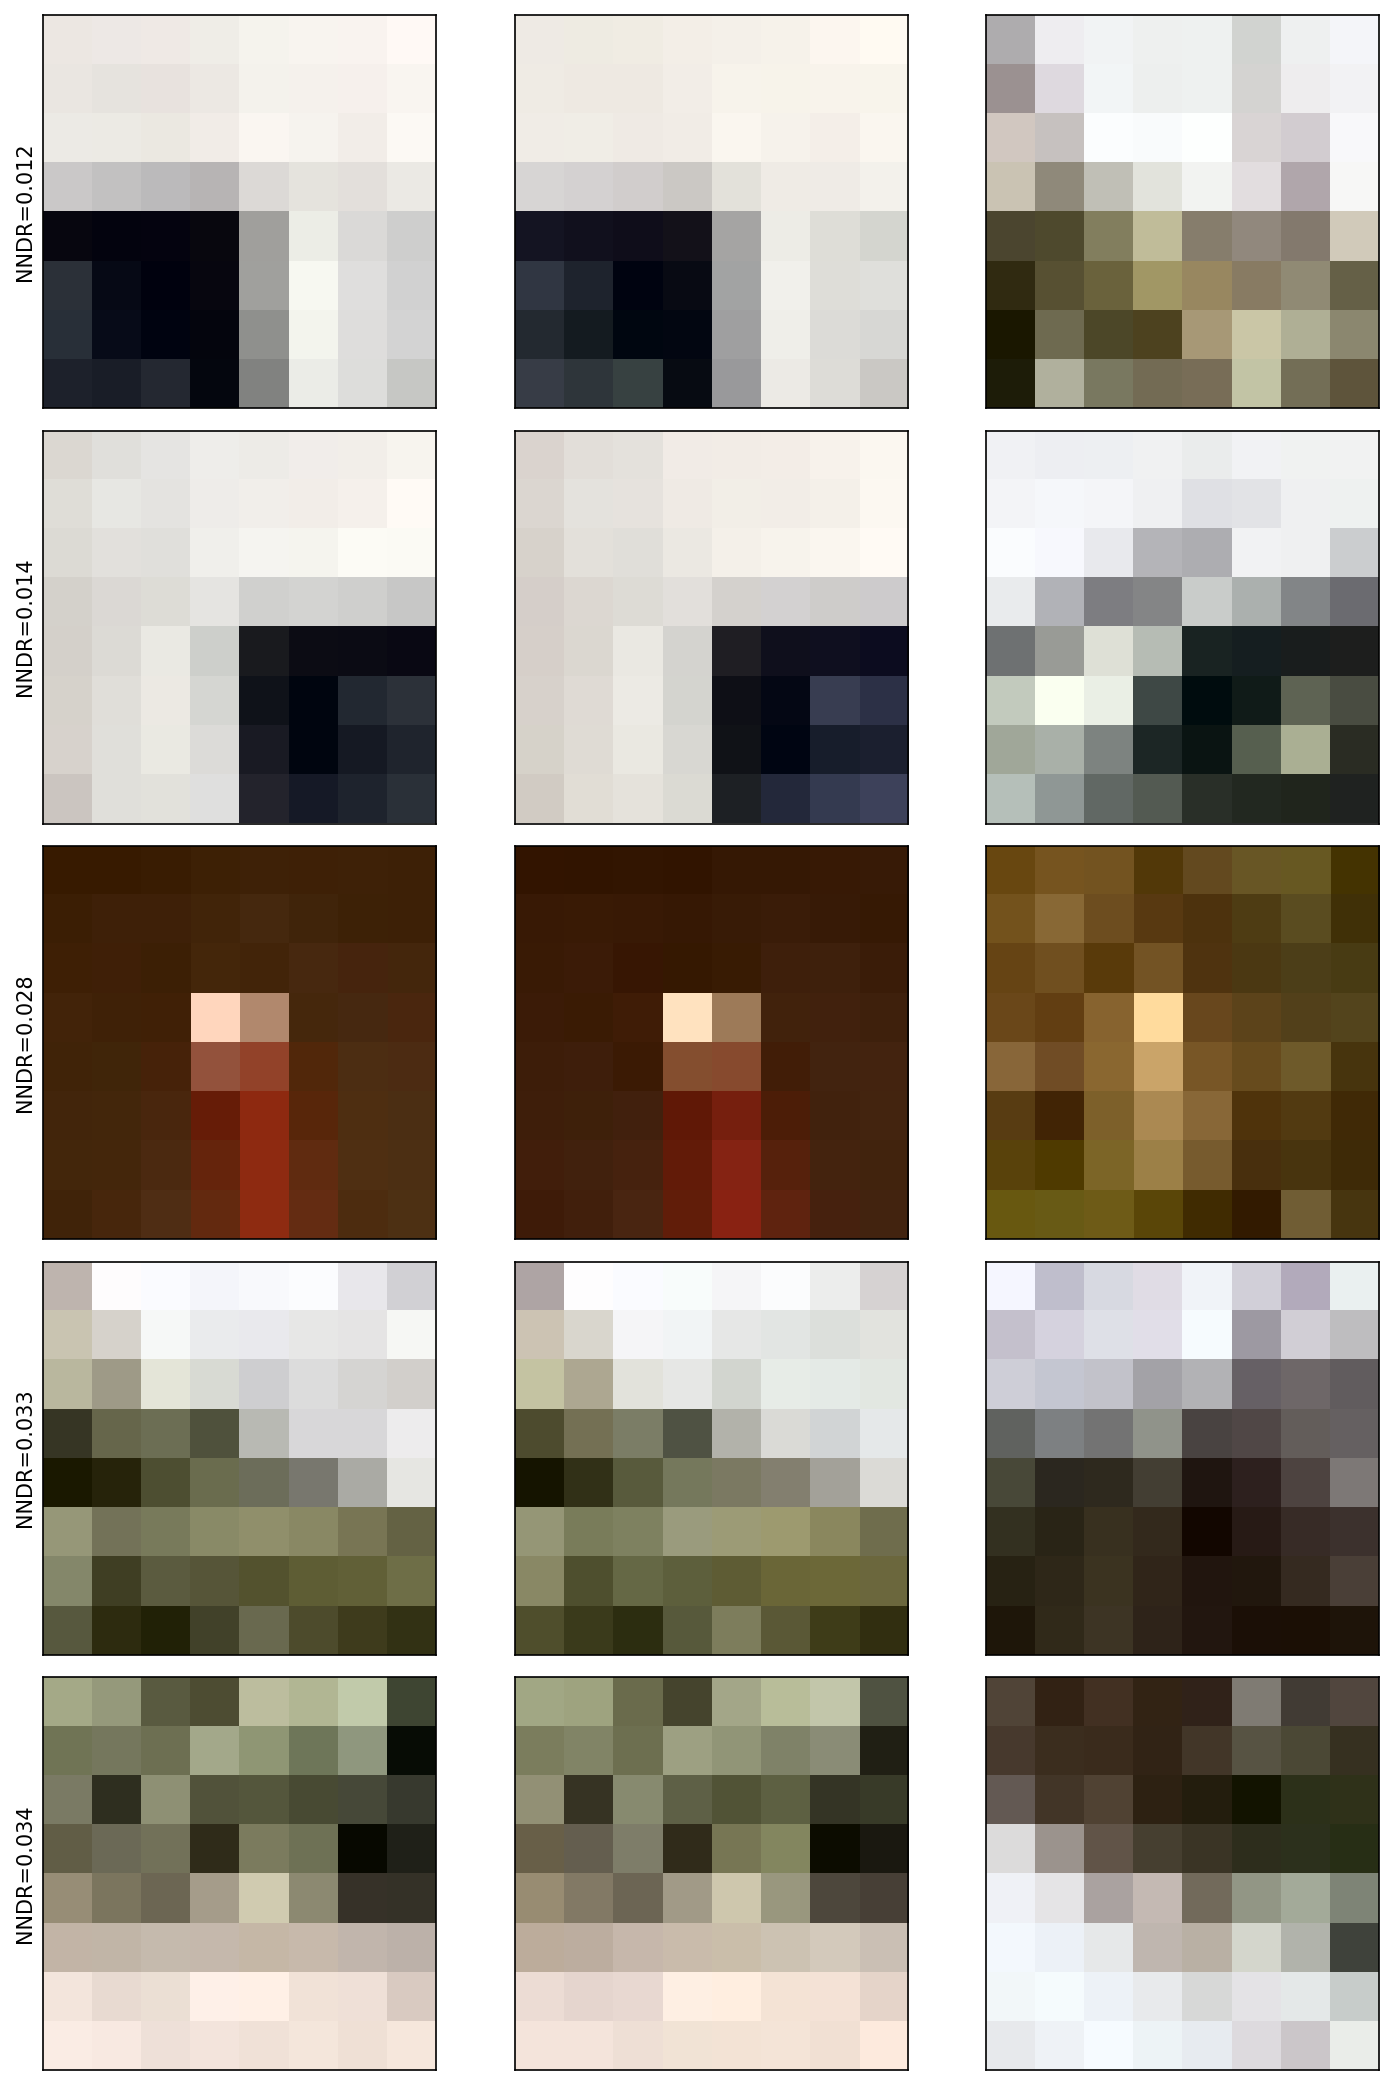
The resized 8×8×3 patch is flattened into a 192-dimensional descriptor. Each descriptor is normalized to zero mean and unit standard deviation; an epsilon of 1e-8 prevents division by zero for near-flat patches such as sky. Because normalized descriptors may fall outside the 0–1 display range, the top-match visualization renormalizes them only for display.
4. SSD Matching & NNDR Filtering
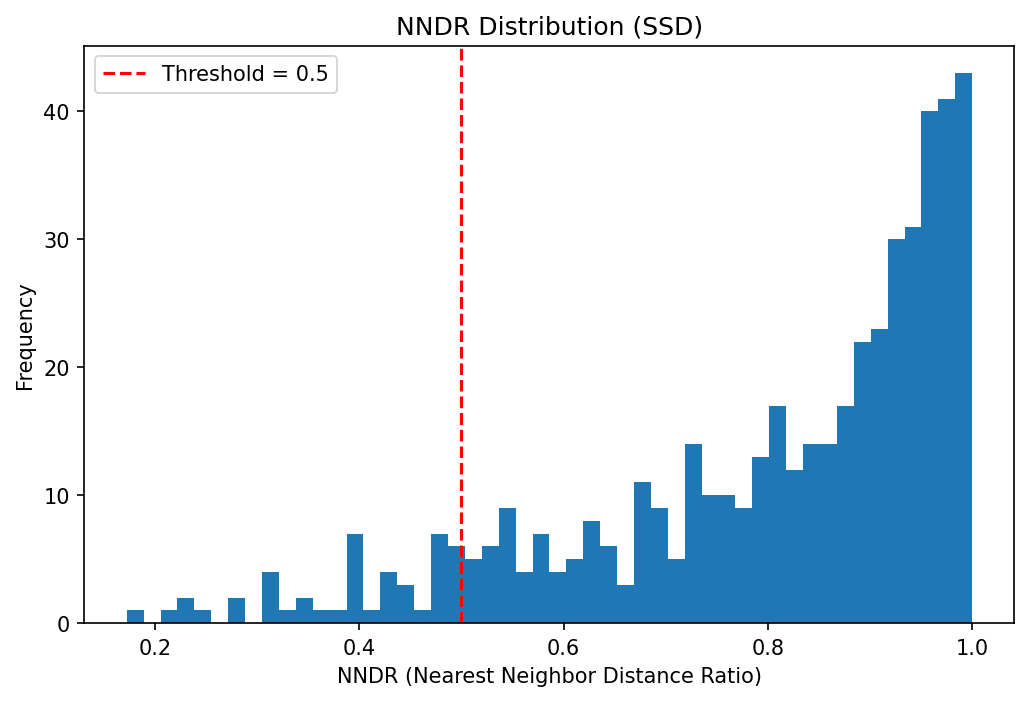
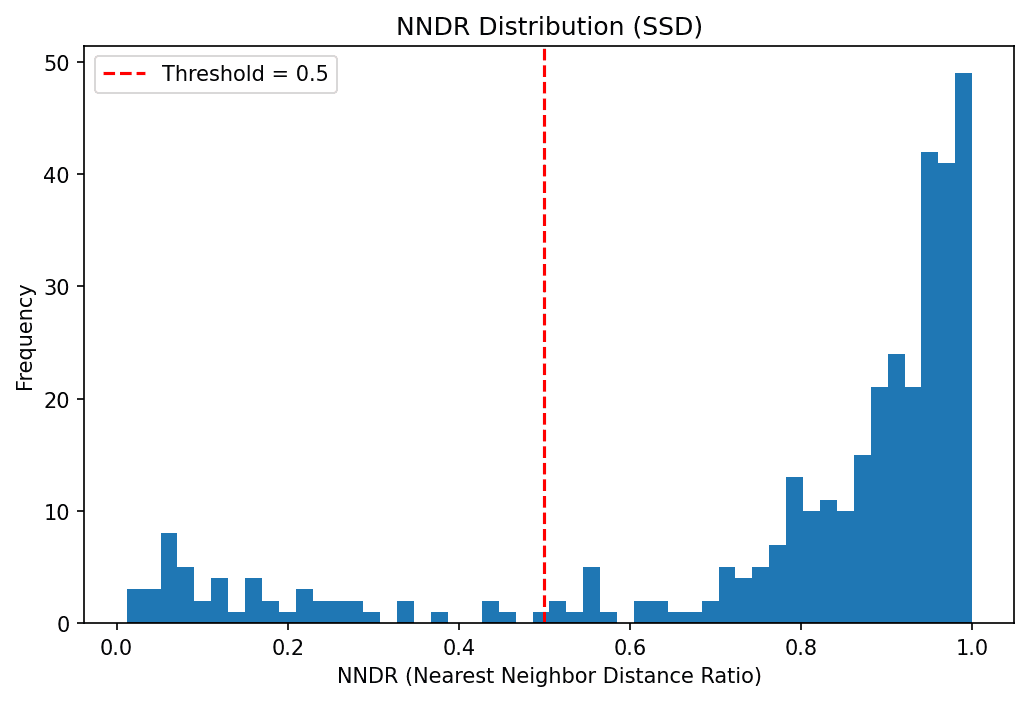
The provided dist_SSD routine produces a pairwise squared-Euclidean-distance matrix between descriptors from both images. For each descriptor in image one, I find its closest and second-closest descriptors in image two, then calculate the nearest-neighbor distance ratio (NNDR).
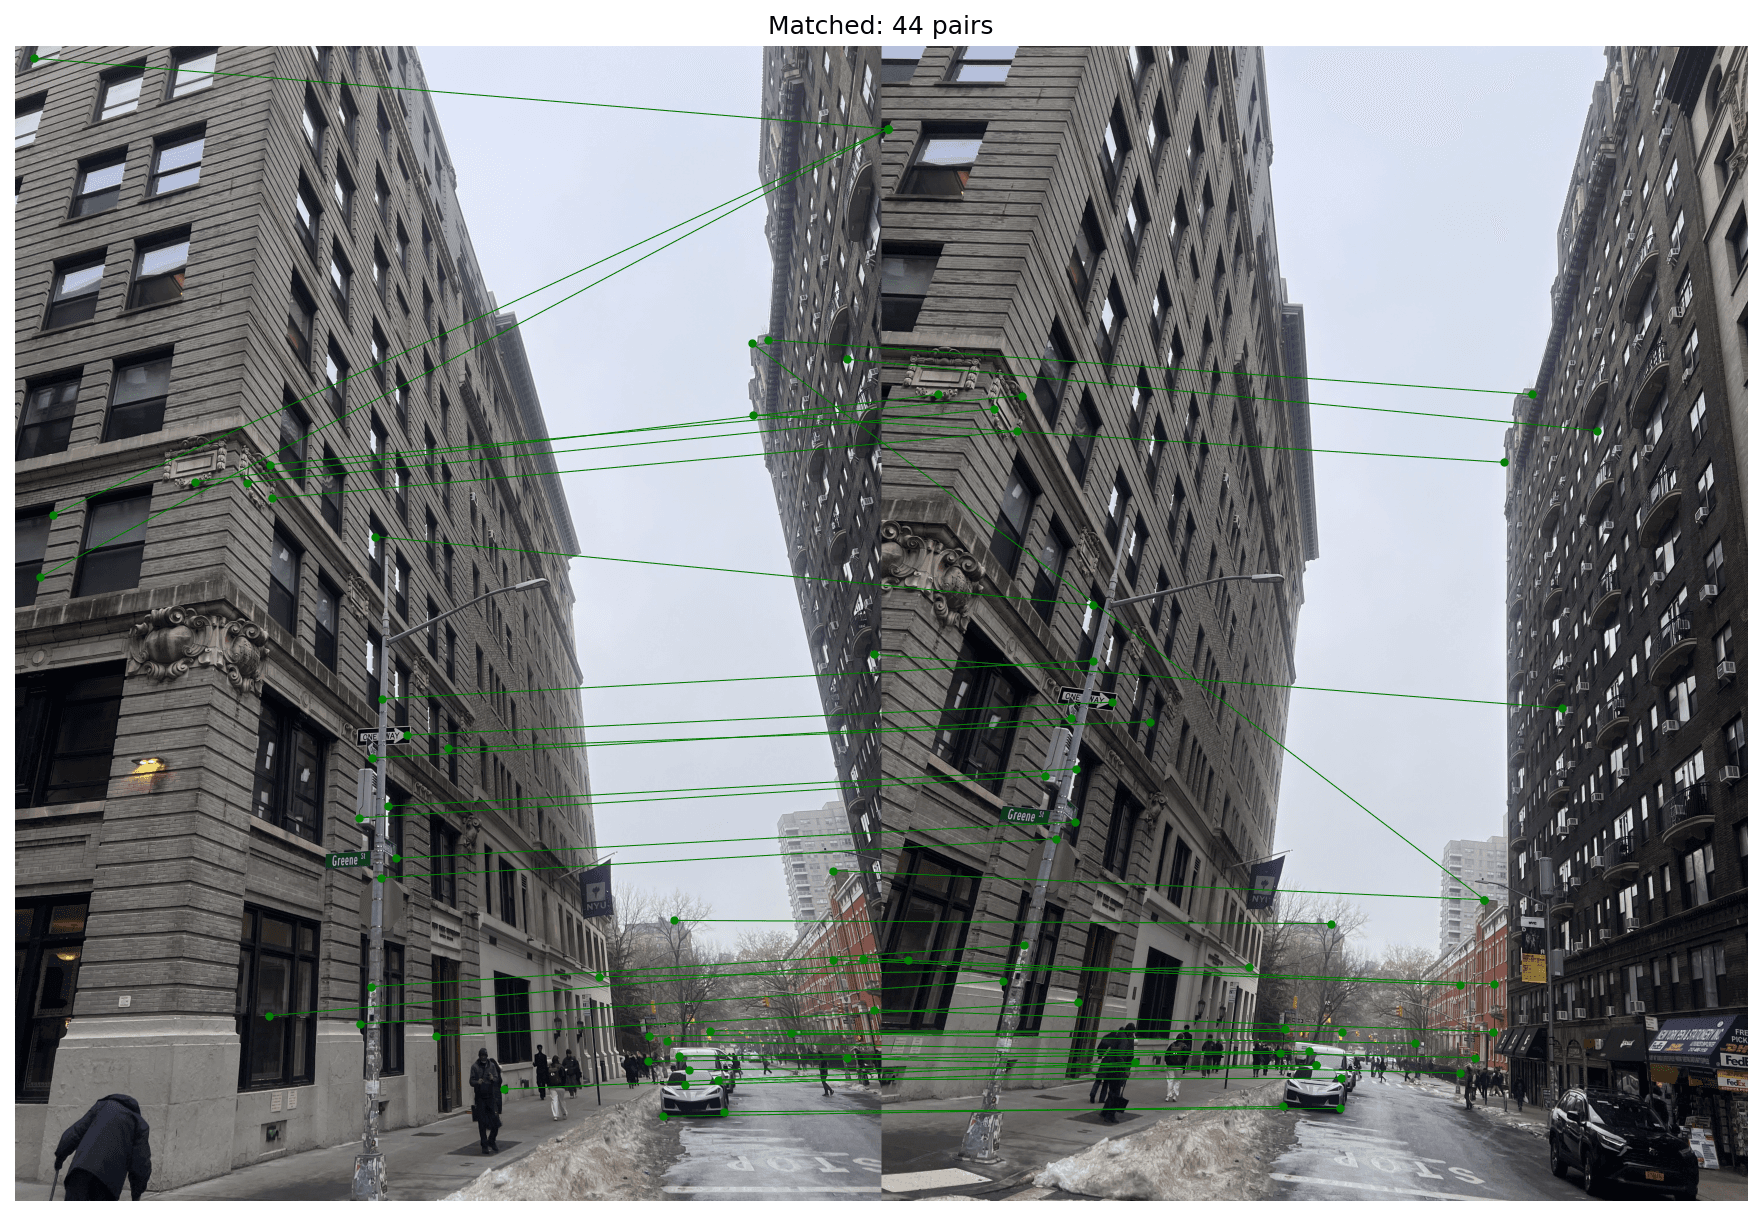
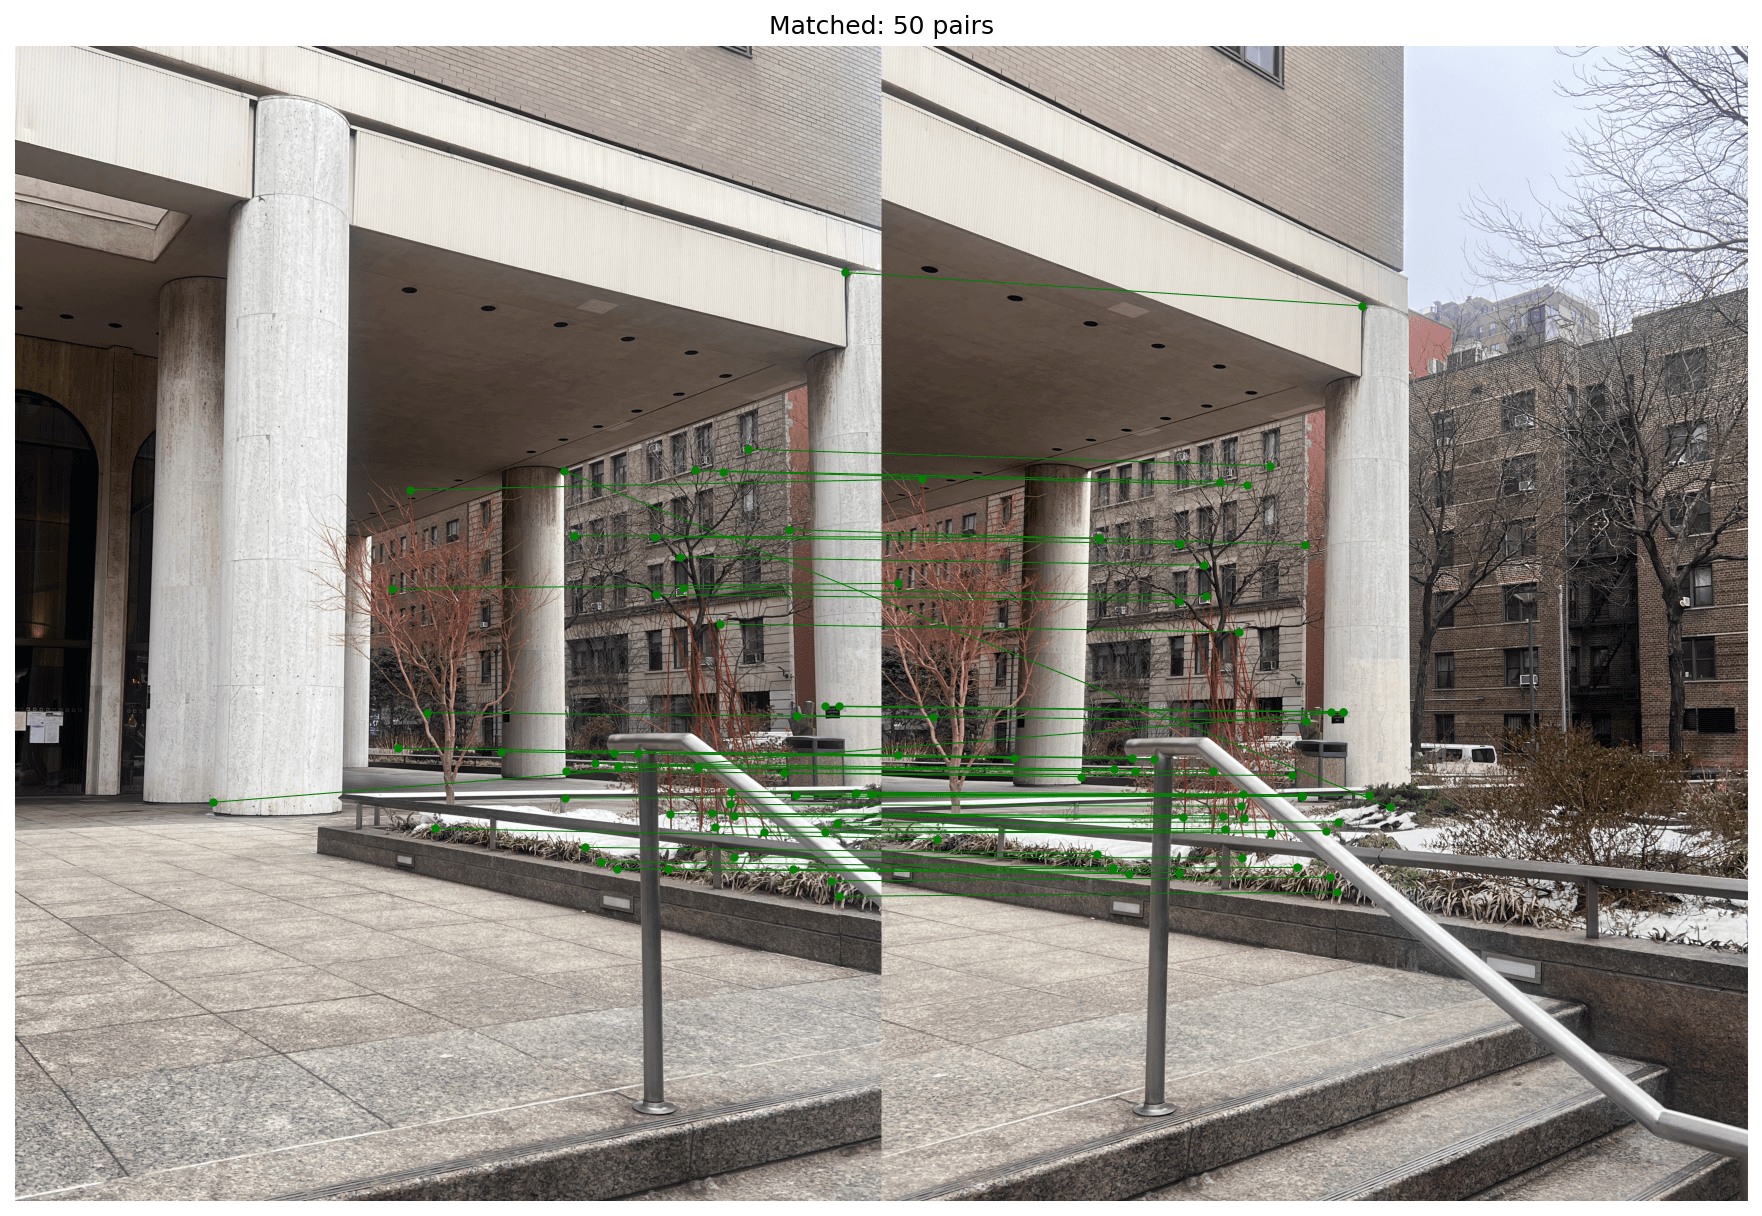
Matches are accepted only when the ratio is below 0.5. A strong match should have a substantially closer nearest neighbor than its runner-up; ambiguous descriptors produce a higher ratio and are rejected. Final matches are ordered by ratio, then rendered both as top-five patch comparisons and as correspondences over the full image pair.
Implementation Notes
Key failure modes were excessive raw corner counts, an early NMS strengths-array bug, and the cost of comparing every candidate. Pre-filtering candidates before suppression, preserving coordinate order as (y, x), and sorting by response strength made the pipeline both more reliable and practical.
The detector, suppression, descriptor extraction, SSD matching, and NNDR filtering are implemented and documented in the project code.